SQS Queue Drama
So here is an interesting problem that I came across recently with a customers solution. It’s one of those problems that seems so simple when you find out what is happening but can take an annoying amount of time to diagnose when it is happening.
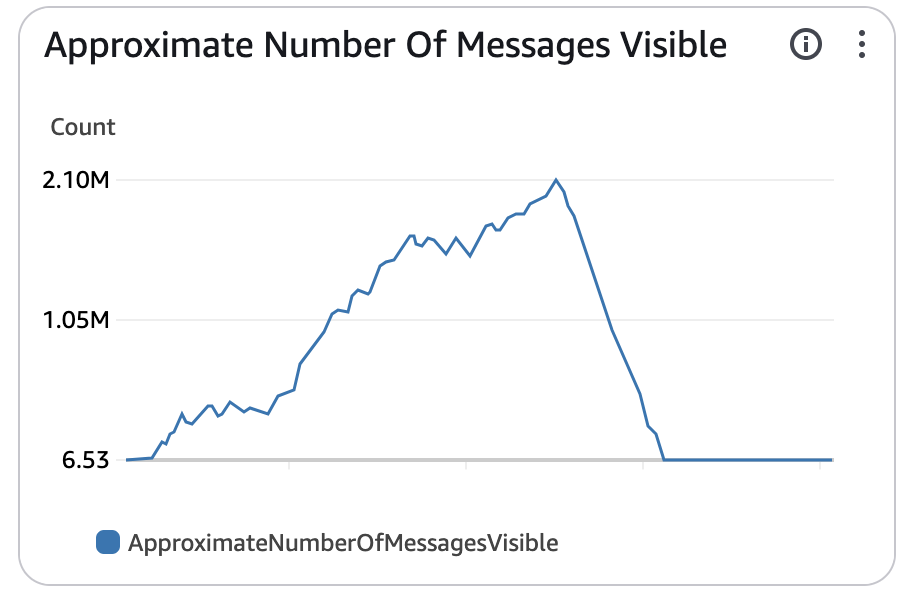
The problem was that the number of messages visable was growing considerably every day on the SQS queue. This didn’t make much sense. Let’s have a look at why this was so strange and then the eventual simple solution.

Why this was weird?
-
The input into this queue didn’t change, there was no additional load being applied, the load had been consistent for well over a year with no issues.
-
The code around the queue and its consumers had not changed within a year either, it had been performing perfectly well up until this point, there had been no changes to the infrastructure or backend code.
-
The servers were running using spot instances, but again there was no early terminations or other lifecycle management of the spot instances that could have affected this.
-
There were no obvious error messages in the logs for the consumers, they appeared to be processing messages successfully, happily churning through thousands of messages.
But the load wasn’t going down, it was just continuously growing on the queue.
So what on earth was happening?
Well given all of this information we have to start looking at this analytically and ruling out parts of the solution. We can see that it cant be a recent code change, it cant be an increase in load, it cant be the servers being dropped. So what would cause this?
If we pause for a moment and think about how the queue is working we can narrow it down. Messages are being pushed to the queue constantly, and the consumers are constantly pulling data from the queue. This load level hasn’t changed and yet the queue is growing, so the only explanation must be with the consumers, but they seemed to be processing the messages fine, tens of thousands of messages were being processed.
So what could cause a consumer to be successfully processing a message but still leading to the queue size increasing…….
The visibility timeout, thats what.
In our case here the visibility timeout was set to 30 seconds, which seemed like a reasonable amount of time when messages were typically processed within a couple of seconds. However, when just a few messages were more complex and added to the queue, and they started taking longer than 30 seconds to process, the entire thing collapsed.
What was happening?
Well one of these complex messages was added to the queue, this was then picked up by a consumer who took slightly longer than 30 seconds to process it. There were no errors as the message was eventually successfully processed. However the visibility timeout kicked in as it took longer than 30 seconds and the SQS queue essentially assumed that consumer was dead and so it gave that same complex message to another consumer, which then also took longer than 30 seconds, so SQS then gave it to another consumer… and so on.
This meant that with a small flood of complex messages the entire system was taken down and it never recovered. Threads were being locked up by the constant retries of the same messages, and so the amount of actual work the consumers could perform was severely limited.
What to do?
Well firstly set the visibility timeout to something sensible, and by sensible I mean something dramatically higher than what you believe the longest processing time could be. Either this has to be set or else you need to dynamically increase it when your consumer starts to take too long to process the message.
Also you should have a limit in number of retries of messages and a dead letter queue for messages that have been marked as failing on consumers.
Doing this should ensure that you donw end up in the strange situation where your queue is growing but there are no errors.

